Archives December 2025

UG MIC1 Geography Examination 2025 Patliputra University, Patna

UG MIC1 Geography Examination 2025 

Patliputra University, Patna


UG MIC1 Geography Examination 2025 

UG (Regular) (Sem.-I) Examination, 2025

(Session: 2025-29)

(MIC-1: MINOR CORE COURSE)

GEOGRAPHY

Paper Code : 420801

(Geomorphology)

Time: Three Hours] [Maximum Marks: 70

Note: Candidates are required to give their answers in their own words as far as practicable. The figures in the margin indicate full marks. Answer from all sections as directed.

परीक्षार्थी यथासम्भव अपने शब्दों में ही उत्तर दें। उपांत के अंक पूर्णांक के द्योतक हैं। निर्देशानुसार सभी खण्डों से उत्तर दीजिए।

Section-A / खण्ड-अ

(Objective Type Questions)

(वस्तुनिष्ठ प्रश्न)

Note : Choose the correct option from each question:

1. प्रत्येक प्रश्न से सही विकल्प का चयन कीजिए: [10×2=20]

(i) Who proposed the Gaseous Hypothesis of the origin of the Earth?

(a) Immanuel Kant

(b) Pierre-Simon Laplace

(c) George Buffon

(d) James Jeans

पृथ्वी की उत्पत्ति की गैसीय परिकल्पना किसने प्रतिपादित की?

(a) इमैनुअल कांट

(b) पियरे साइमन लाप्लास

(c) जॉर्ज बफन

(d) जेम्स जीन्स

(ii) The boundary between the crust and the mantle is known as

(a) Gutenberg Discontinuity

(b) Mohorovicic Discontinuity

(c) Conrad Discontinuity

(d) Lehmann Discontinuity

भूपटल और मेंटल के बीच की सीमा को क्या कहा जाता है?

(a) गुटेनबर्ग विस्मयता

(b) मोहोरोविकिक विस्मयता

(c) कॉनराड विस्मयता

(d) लेहमैन विस्मयता

(iii) Which waves cannot pass through the Earth’s outer core?

(a) S-waves

(b) P-waves

(c) Surface waves

(d) Both (a) and (b)

पृथ्वी की बाह्य कोर से कौन-सी तरंगे नहीं गुजर सकती?

(a) एस-तरंगे

(b) पी-तरंगे

(c) सतही तरंगे

(d) दोनों (a) और (b)

(iv) Which of the following is not true about seismic waves?

(a) P-waves can pass through solids, liquids, and gases

(b) S-waves can travel only through solids

(c) P-waves travel slower than S-waves

(d) The speed of seismic waves increases with depth in the mantle

निम्नलिखित में से कौन-सा कथन भूकंपीय तरंगों के बारे में सही नहीं है?

(a) पी-तरंगे ठोस, द्रव और गैसों से गुजर सकती हैं

(b) एस-तरंगे केवल ठोस माध्यमों से यात्रा कर सकती हैं

(c) पी-तरंगें एस-तरंगों से धीमी गति से चलती हैं

(d) मेंटल की गहराई के साथ भूकंपीय तरंगों की गति बढ़ती है

(v) Which of the following is an endogenic geomorphic process?

(a) Weathering

(b) Deposition

(c) Erosion

(d) Earthquake

निम्नलिखित में से कौन-सी एक अंतर्जात भू-पृष्ठीय प्रक्रिया है?

(a) अपक्षय

(b) निक्षेपण

(c) कटाव

(d) भूकंप

(vi) Which rock is formed from the cooling of lava on the Earth’s surface?

(a) Basalt

(b) Marble

(c) Gneiss

(d) Shale

पृथ्वी की सतह पर लावा के ठंडा होने से बनी शिला कौन-सी है?

(a) बेसाल्ट

(b) संगमरमर

(c) ग्नाइस/ग्निस

(d) शेल

(vii) The process of formation of landforms due to internal forces is known as:

(a) Denudation

(b) Gradation

(c) Diastrophism

(d) Mass wasting

आंतरिक बलों द्वारा स्थल के निर्माण की प्रक्रिया को कहते हैं:

(a) अनाच्छादन

(b) समकोटिकरण

(c) पटलविरूपण

(d) गुरुत्वीय ढलान क्रिया

(viii) Gully erosion is most commonly associated with:

(a) Glacial movement

(b) Deflation

(c) Running water

(d) Earthquakes

गली अपरदन सामान्यतः किससे जुड़ा होता है?

(a) हिमानी संचलन

(b) अपक्षारण

(c) बहता जल

(d) भूकम्प

(ix) The Benioff Zone is associated with:

(a) Volcanic arcs at divergent margins

(b) Earthquake zones at subduction boundaries

(c) Mantle plume zones

(d) Sea-floor spreading centres

बेनिऑफ जोन किससे सम्बन्धित है?

(a) डायवर्जेंट सीमाओं पर ज्वालामुखी चाप

(b) सबडक्शन सीमाओं पर भूकंपीय क्षेत्र

(c) मेंटल प्लूम क्षेत्र

(d) समुद्र तल प्रसारण केन्द्र

(x) Which volcanic landforms results from a collapsed magma chamber after a major eruption?

(a) Composite cone

(b) Lava dome

(c) Shield volcano

(d) Caldera

प्रचंड विस्फोट के बाद मैग्मा चैंबर के ढहने से बनने वाली आकृति है:

(a) मिश्रित शंकु

(b) लावा गुंबद

(c) शील्ड ज्वालामुखी

(d) काल्डेरा

Section-B / खण्ड-ब

(Short Answer Type Questions)

(लघु उत्तरीय प्रश्न)

Note: Answer any four questions of the following: [4×5=20]

निम्नलिखित में से किन्हीं चार प्रश्नों के उत्तर दीजिए

2. Describe the internal structure of the Earth with a labelled diagram.

पृथ्वी की आंतरिक संरचना का संक्षिप्त वर्णन कीजिए।

3. What is the Gaseous Hypothesis regarding the origin of the Earth? Explain its main features.

पृथ्वी की उत्पत्ति से सम्बन्धित गैसीय परिकल्पना क्या है? इसके मुख्य विशेषताओं की व्याख्या कीजिए।

4. How are Sedimentary rocks formed? Give examples.

अवसादी चट्टानें कैसे बनती हैं? उदाहरण सहित समझाइए।

5. Differentiate between intrusive and extrusive volcanic
landforms with examples.

उदाहरण सहित अंतःनवनीय और बहिःनवनीय ज्वालामुखी स्थलरूपों में अन्तर स्पष्ट कीजिए।
6. What are Earthquakes? Describe their causes and types.

भूकम्प क्या है? इनके कारणों एवं प्रकारों का वर्णन कीजिए।

7. Differentiate between convergent, divergent and transform plate boundaries with suitable diagrams.

उचित आरेखों सहित अभिसारी, अपसारी और रूपांतरण प्लेट सीमाओं में अन्तर स्पष्ट कीजिए।

Section-C / खण्ड-स

(Long Answer Type Questions)

(दीर्घ उत्तरीय प्रश्न)

Note: Answer any three questions of the following: [3×10=30]

निम्नलिखित में से किन्हीं तीन प्रश्नों के उत्तर दीजिए:

8. Explain the Binary Star hypothesis about the origin of the Earth and the solar system.

पृथ्वी और सौरमंडल की उत्पत्ति के बारे में द्वितारा परिकल्पना की व्याख्या कीजिए।

9. What is Weathering? Describe the different types of weathering with suitable examples.

अपक्षय क्या है? अपक्षय के विभिन्न प्रकारों को उदाहरण सहित समझाइए।

10.What is a Volcano? Describe the types of volcanoes based on eruption style.

ज्वालामुखी क्या होता है? उद्गार शैली के आधार पर ज्वालामुखियों के प्रकारों को समझाइए।

11. Explain the major erosional landforms formed by the wind.

पवन द्वारा निर्मित अपरदनकारी भू-आकृतियों की व्याख्या कीजिए।

12. What is the Plate Tectonics theory? Explain its major features.

प्लेट विवर्तनिकी सिद्धान्त क्या है? इसकी मुख्य विशेषताओं की व्याख्या कीजिए। 

UG Regular Semester-I Examination 2025 Patliputra University, Patna QUESTION PAPER

UG Regular Semester-I Examination 2025

Patliputra University, Patna

QUESTION PAPER


UG Regular Semester-I Examination 2025

(Major Core Course or MJC-1)

(Session: 2025-29)

Paper Code : 410801

Geomorphology (Theory)

Time: Three Hours] [Maximum Marks: 70

Note : Candidates are required to give their answers in their own words as far as practicable. The figures in the margin indicate full marks. Answer from all the sections as directed.

परीक्षार्थी यथासंभव अपने शब्दों में ही उत्तर दें। उपांत के अंक पूर्णांक के द्योतक हैं। निर्देशानुसार सभी खण्डों से उत्तर दें।

Section-A / खंड -अ

(Objective Type Questions)

(वस्तुनिष्ठ प्रश्न)

Note : Attempt all Multiple choice questions from this part. Each question carries 2 marks. [10×2=20]

इस भाग से सभी बहुविकल्पीय प्रश्नों को हल कीजिए। प्रत्येक प्रश्न 2 अंक का है।

1. Choose the correct option from each question:

प्रत्येक प्रश्न से सही विकल्प का चयन कीजिए:

(i) Which is the outermost layer of the Earth?

(a) Mantle

(b) Core
(c) Crust

(d) Lithosphere

पृथ्वी की सबसे बाहरी परत कौन-सी है?

(a) मेंटल

(b) कोर

(c) क्रस्ट

(d) स्थलमंडल

(ii) What does the Big Bang Theory explain:

(a) The end ofthe universe

(b) The structure of the Earth

(c) The origin of the universe

(d) The movement of galaxies

बिग बैंग सिद्धान्त किसकी व्याख्या करता है?

(a) ब्राह्मांड का अंत

(b) पृथ्वी का संरचना

(c) ब्रह्मांड की उत्पत्ति

(d) आकाशगंगाओं की गति

(iii) Which layer of the Earth is broken into tectonic plates?

(a) Inner Core

(b) Asthenosphere

(c) Lithosphere

(d) Mantle

पृथ्वी की कौन-सी परत विवर्तनिक प्लेटों में विभाजित होती है?

(a) आंतरिक कोर

(b) एस्थेनोस्फीयर

(c) स्थलमंडल

(d) मेंटल

(iv) The boundary where two tectonic plates move away from each other is called:

(a) Convergent boundary

(b) Transform boundary

(c) Divergent boundary

(d) Passive margin

जिस सीमा पर दो प्लेट एक-दूसरे से दूर हटती हैं? उसे क्या कहा जाता है?

(a) अभिसरण सीमा

(b) परिवर्तित सीमा

(c) अपसारी सीमा

(d) निष्क्रिय किनारा

Which of the following is a major cause of volcanic eruptions?

(a) Solar radiation

(b) Movement of tectonic plates

(c) Weathering

(d) Ocean currents

निम्नलिखित में से कौन ज्वालामुखी विस्फोट का प्रमुख कारण है?

(a) सौर विकिरण

(b) विवर्तनिक प्लेटों की गति

(c) अपक्षय

(d) समुद्री धाराएं

(vi) What is the point inside the Earth where an earthquake originates called?

(a) Epicenter

(b) Focus (Hypocenter)

(c) Fault line

(d) Seismic zone

पृथ्वी के अन्दर वह स्थान जहाँ भूकम्प की उत्पत्ति होती है, क्या कहलाता है?

(a) उपकेन्द्र

(b) केन्द्र बिन्दु

(c) अंश रेखा

(d) भूकम्पीय क्षेत्र

(vii) Karst topography is primarily formed due to the action of:

(a) Wind

(b) Glaciers

(c) Groundwater action on limestone

(d) Volcanic activity

कार्स्ट स्थलाकृति मुख्य रूप से निम्नलिखित की क्रिया के कारण बनती है:

(a) पवन

(b) हिमनद

(c) चूना पत्थर पर भूमिगत जल की क्रिया

(d) ज्वालामुखी गतिविधि

(viii) Which of the following is a depositional feature formed by glaciers?

(a) Cirque

(b) Moraine

(c) Arete

(d) U-shaped valley

निम्नलिखित में से कौन-सी स्थलरूपी संरचना हिमनदों द्वारा निक्षेपण के कारण बनती है?

(a) सर्क

(b) मोरेन

(c) एरेट

(d) यू-आकार की घाटी

(ix) Which of the following landforms is commonly found in arid regions?

(a) Cirque

(b) Yardang

(c) Moeraine

(d) Delta

निम्नलिखित में से कौन-सी स्थलाकृति शुष्क क्षेत्रों में पाई जाती है?

(a) सर्क

(b) यारडांग

(c) मोरेन

(d) डेल्टा

(x) A mushroom rock is formed due to:

(a) Glacial erosion

(b) Volcanic activity

(c) Wind erosion

(d) Chemical weathering

मशरूम चट्टान किसके कारण बनती है?

(a) हिमनदी अपरदन

(b) ज्वालामुखी क्रिया

(c) पवन अपरदन

(d) रासायनिक अपक्षय

PART-B / भाग-ब

(Short Answer Type Questions)

(लघु उत्तरीय प्रश्न)

Note: Answer any four questions. Each question carries 5 marks. [4×5=20]

निम्नलिखित में से किन्हीं चार प्रश्नों के उत्तर दीजिए। प्रत्येक प्रश्न 5 अंकों का है।

2. Discuss is briefabout the scope of Geomorphology.

भू-आकृति विज्ञान के क्षेत्र पर संक्षेप में चर्चा कीजिए।

3. Discuss about the convergent plate boundary.

अभिसारी प्लेट सीमा के बारे में चर्चा कीजिए।

4. Write about the different types of volcanoes.

ज्वालामुखियों के विभिन्न प्रकारों के बारे में लिखिए।
5. Write about the difference between the Weathering and Erosion Process.

अपघटन और अपरदन की प्रक्रियाओं में क्या अंतर है? लिखिये।

6. Explain the major landforms created by glacial erosion.

हिमानी अपरदन द्वारा निर्मित प्रमुख स्थलरूपों की व्याख्या कीजिए।

What is isostasy? Discuss the postulates made by Airy or Pratt.

समस्थिति क्या है? एयरी या प्रेट द्वारा दिए गए सिद्धान्तों की चर्चा कीजिए।

PART-C/ भाग-स

(Long Answer Type Questions)

(दीर्घ उत्तरीय प्रश्न)

Note: Answer any three questions. Each question carries 10 marks. [3×10-30]

निम्नलिखित में से किन्हीं तीन प्रश्नों के उत्तर दीजिए। प्रत्येक प्रश्न 10 अंकों का है।
8. Explain the Nebular Hypothesis or Tidal Hypothesis and discuss its importance in understanding the origin of the Earth.

निहारिका सिद्धान्त अथवा ज्वारीय सिद्धान्त की व्याख्या कीजिए तथा पृथ्वी की उत्पत्ति को समझने में इसकी महत्ता पर चर्चा कीजिए।
9. Describe the internal structure of the Earth with the help of a labelled diagram.

पृथ्वी की आन्तरिक संरचना का वर्णन एक चिन्हित आरेख की सहायता से कीजिए।
10. Describe Alfred Wagener’s Continental Drift Theory.

अल्फ्रेड वेगनर के महाद्वीपीय विस्थापन सिद्धान्त का वर्णन कीजिए।
11. Explain the theory of mountain building proposed by Kober or Holmes.

कोबर या होम्स द्वारा प्रस्तुत पर्वत निर्माण सिद्धान्त की व्याख्या कीजिए।
12. Explain the Normal cycle of Erosion as proposed by William Morris Davis.

विलियम मॉरिस डेविस द्वारा प्रतिपादित सामान्य अपरदन चक्र की व्याख्या कीजिए।

17. Nearest Neighbor Analysis (निकटतम पड़ोसी विश्लेषण)

Nearest Neighbor Analysis

(निकटतम पड़ोसी विश्लेषण)


Nearest Neighbor Analysis

परिचय

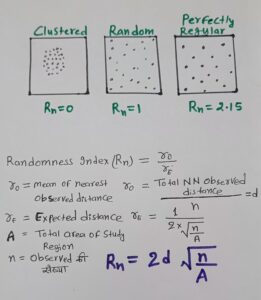
    निकटतम पड़ोसी विश्लेषण (Nearest Neighbor Analysis) एक प्रकार की स्थानिक सांख्यिकीय तकनीक है जिसका उपयोग भौगोलिक प्रतिरूप, वितरण और दूरी के अध्ययन के लिए किया जाता है।

    यह विश्लेषण बताता है कि किसी वस्तु (जैसे कि शहर, पौधे, जीव, अपराध स्थल आदि) का वितरण सांख्यिकीय रूप से समूहित (Clustered), यादृच्छिक (Random) या समान (Regular/Uniform) रूप से फैलाव वाला  है या नहीं।

    भौगोलिक सूचना प्रणाली (GIS) और स्थानिक आंकड़ों के अध्ययन में यह तकनीक अत्यंत महत्वपूर्ण है क्योंकि यह स्थानिक संरचना और प्रतिरूप का वैज्ञानिक मूल्यांकन करने में मदद करती है।

उद्देश्य

    निकटतम पड़ोसी विश्लेषण के मुख्य उद्देश्य निम्नलिखित हैं:

(i) किसी वस्तु का स्थानिक वितरण पैटर्न पहचानना।

(ii) यह जांचना कि क्या वितरण यादृच्छिक, समूहित या समान रूप से फैला है।

(iii) शहरी और ग्रामीण योजना में केंद्रों की उचित व्यवस्था सुनिश्चित करना।

(iv) आर्थिक और पर्यावरणीय अध्ययन में प्राकृतिक संसाधनों के वितरण का विश्लेषण।

(v) आपदा प्रबंधन और आपूर्ति श्रृंखला योजना में उपयोग।

सिद्धांत

     निकटतम पड़ोसी विश्लेषण निम्नलिखित आधार पर कार्य करता है:

⇒ प्रत्येक बिंदु के लिए सबसे नजदीकी पड़ोसी की दूरी मापी जाती है।

⇒ इन दूरी का औसत लिया जाता है।

⇒ इसे यादृच्छिक वितरण से तुलना की जाती है।

⇒ यदि बिंदु बहुत पास-पास हैं तो सामूहिक (Clustered)

⇒ यदि बिंदु असमान हैं तो यादृच्छिक (Random)

⇒ यदि बिंदु एक समान रूप से फैले हैं तो समान (Regular/Uniform)

मुख्य सूत्र:

Rn (Randomness Index) अनुपात निकालना:

Nearest Neighbor Analysis

उपयोग

(i) शहरी योजना: विद्यालय, अस्पताल, बस स्टॉप आदि का स्थानिक वितरण समझने के लिए।

(ii) पर्यावरण अध्ययन: पौधों और जीवों का वितरण।

(iii) अपराध भूगोल: अपराध स्थलों का क्लस्टरिंग पैटर्न पहचानना।

(iv) संसाधन प्रबंधन: जल स्रोत, खनिज आदि का स्थानिक विश्लेषण।

(v) सामाजिक अध्ययन: बाजार, बैंक या अन्य सेवाओं का वितरण।

निष्कर्ष:

     निकटतम पड़ोसी विश्लेषण एक सरल परंतु शक्तिशाली तकनीक है, जो स्थानिक वितरण पैटर्न को समझने और मूल्यांकन करने में मदद करती है। यह शहरी, पर्यावरणीय, आर्थिक और सामाजिक अध्ययन में अत्यंत उपयोगी है। सही डेटा और सॉफ्टवेयर टूल के साथ, यह यादृच्छिक, समूहित और समान वितरण को स्पष्ट रूप से पहचान सकता है और नीति निर्माण और योजना में महत्वपूर्ण योगदान देता है।

16. Regression Analysis (प्रतीगमन या प्रत्यागमन विश्लेषण)

Regression Analysis

(प्रतीगमन या प्रत्यागमन विश्लेषण)


Regression Analysis

परिचय

      ‘प्रतीपगमन’ (Regression) शब्द का अर्थ ‘पीछे लौटना’ अथवा ‘वापस आना’ (to regress or return back) है। इस शब्द का सर्वप्रथम प्रयोग 1877 में सर फ्रांसिस गाल्टन (Sir Francis Galton) ने अपने शोध लेख ‘पैतृक ऊँचाई में मध्यमता की ओर प्रतीपगमन’ (Regression towards mediocrity in hereditary stature) में किया था।

     प्रत्यागमन विश्लेषण (Regression Analysis) सांख्यिकी का एक अत्यंत महत्वपूर्ण विश्लेषणात्मक उपकरण है, जिसका उपयोग दो या दो से अधिक चर (Variables) के बीच संबंधों का अध्ययन करने के लिए किया जाता है। यह न केवल चर के बीच संबंधों की दिशा एवं ताकत को मापता है, बल्कि इस आधार पर भविष्य के मूल्यों का पूर्वानुमान (Prediction) भी करता है। इसीलिए इसे पूर्वानुमान के लिए सबसे प्रभावी सांख्यिकीय विधियों में से एक माना जाता है।

      प्रत्यागमन विश्लेषण मुख्य रूप से निर्भर चर (Dependent Variable) और स्वतंत्र चर (Independent Variable) के बीच संबंधों पर आधारित होता है। उदाहरण के लिए, यदि हम जानना चाहें कि किसी छात्र के परीक्षा-अंक उसकी पढ़ाई के घंटों पर कैसे निर्भर करते हैं, तो हम Regression Analysis का उपयोग करेंगे।

प्रत्यागमन विश्लेषण की परिभाषा     

      “Regression उस सांख्यिकीय तकनीक को कहते हैं जिसके द्वारा दो चर के बीच मात्रात्मक संबंध स्थापित किया जाता है और उसके आधार पर संबंधित चर के मूल्यों का अनुमान लगाया जाता है।”

सक्षेप में-

    Regression वह पद्धति है जिसमें हम एक चर के माध्यम से दूसरे चर के मूल्यों का अनुमान लगाते हैं।

Regression Analysis की आवश्यकता और उपयोगिता

(i) पूर्वानुमान (Prediction):-

          Regression Analysis की आवश्यकता और उपयोगिता पूर्वानुमान में इसलिए है कि यह चर (variables) के बीच संबंध स्थापित कर भविष्य के मानों का अनुमान लगाने, रुझान पहचानने और निर्णय-निर्धारण में सहायता करता है।

    बिक्री, उत्पादन, मांग, तापमान, GDP, जनसंख्या आदि का भविष्य अनुमान लगाने में उपयोगी।

(ii) निर्णय-निर्माण (Decision Making):-

    Regression Analysis की आवश्यकता निर्णय-निर्माण में इसलिए होती है क्योंकि यह भविष्य के रुझानों का अनुमान, चर-परिवर्तनशीलताओं का प्रभाव और नीतिगत या व्यावसायिक विकल्पों की सटीकता को बढ़ाता है।

(iv) चर-संबंधों का अध्ययन:-

  Regression Analysis की आवश्यकता चर-संबंधों को मात्रात्मक रूप से समझने, पूर्वानुमान बनाने, कारण-प्रभाव दिशा पहचानने और विभिन्न स्वतंत्र चरों का आश्रित चर पर प्रभाव मापने में होती है;

(v) प्रत्यक्ष एवं अप्रत्यक्ष प्रभावों की माप

   जैसे- आय का उपभोग पर प्रभाव, शिक्षा का आय पर प्रभाव।

(vi) वैज्ञानिक व सामाजिक अनुसंधान में उपयोग

    मनोविज्ञान, जनसांख्यिकी, भौतिकी, जीवविज्ञान, भूगोल आदि में व्यापक उपयोग।

Regression के प्रकार (Types of Regression Analysis)

1. Simple Regression (सरल प्रत्यागमन)

     जब एक स्वतंत्र चर और एक निर्भर चर के बीच संबंध स्थापित किया जाता है।

उदा.—उपभोग (Y) = f (आय X)

Regression Equation: Y = a+bX

2. Multiple Regression (बहु-प्रत्यागमन)

जब अनेक स्वतंत्र चर किसी एक निर्भर चर को प्रभावित करते हैं।

उदा.- आय (Y) = शिक्षा (X₁) + अनुभव (X₂) + कौशल (X₃)

Equation: Y=a+b1X1+b2X2+b3X3…….

3. Linear Regression (रेखीय प्रत्यागमन)

    जहाँ निर्भर चर और स्वतंत्र चर के बीच संबंध सीधी रेखा के रूप में हो।

Y = a+bX

Regression Line (प्रत्यागमन रेखा)

    Regression Analysis का मुख्य उद्देश्य एक ऐसी रेखा खोजना होता है जो स्वतंत्र चर और निर्भर चर के बीच न्यूनतम त्रुटि (Minimum Error) के साथ संबंध दर्शाए।

Regression Coefficient (प्रत्यागमन गुणांक)

     Regression coefficient (b) यह बताता है कि स्वतंत्र चर में एक इकाई परिवर्तन होने पर निर्भर चर में कितना परिवर्तन होगा।

उदाहरण:

यदि b = 0.8

तो X में 1 इकाई वृद्धि होने पर Y में 0.8 इकाई वृद्धि होगी।

Regression coefficient के गुण:

⇒ b का मान धनात्मक (+) या ऋणात्मक (–) दोनों हो सकता है।

⇒ b = 0 मतलब दोनों चरों में कोई संबंध नहीं।

⇒ यदि दोनों b (bxy और byx) धनात्मक हों = सीधा संबंध।

⇒ यदि दोनों b ऋणात्मक हों = व्युत्क्रम संबंध।

Regression Analysis का एक सरल उदाहरण

        मान लीजिए किसी छात्र ने पढ़ाई (X) के घंटे और परीक्षा-अंक (Y) का विवरण दिया:

X (घंटे) Y (अंक)
2 40
3 50
4 60
5 70

Regression Equation:

Y=a+bX

यदि गणना से प्राप्त हो:

a = 20, b = 10

तो समीकरण होगा:

Y = 20+10X

यदि X = 6 घंटे पढ़ाई →

Y = 20+10(6)=80

अर्थात छात्र अनुमानतः 80 अंक प्राप्त करेगा।

Correlation और Regression में अंतर

बिंदु Correlation Regression
उद्देश्य संबंध मापना पूर्वानुमान करना
संबंध दिशा केवल दिशा/मजबूती बताता है आश्रित व स्वतंत्र का संबंध बताता है
Variables कोई dependent नहीं Y dependent, X independent
मान सीमा -1 से +1 कोई भी मान
परिणाम r (सहसंबंध गुणांक) Y = a + bX (प्रतिगमन समीकरण)
उपयोग संबंध की मजबूती Prediction (पूर्वानुमान)
निष्कर्ष

     प्रत्यागमन विश्लेषण एक अत्यंत प्रभावी एवं वैज्ञानिक सांख्यिकीय तकनीक है जो विभिन्न क्षेत्रों में भविष्य के अनुमान लगाने, संबंधों को समझने और निर्णय लेने में महत्वपूर्ण भूमिका निभाती है। यह केवल दो चरों के बीच संबंधों का मात्रात्मक विश्लेषण ही नहीं करता, बल्कि इसके आधार पर व्यावहारिक समाधान भी प्रदान करता है।

   सटीक एवं विश्वसनीय आंकड़ों के साथ उपयोग करने पर Regression Analysis शोध, अर्थव्यवस्था, विज्ञान, समाजशास्त्र, नीति-निर्माण और व्यावसायिक क्षेत्रों में अत्यंत उपयोगी सिद्ध होता है।

नोट:  गाल्टन ने लगभग एक सहस्र पिताओं तथा पुत्रो की ऊँचाइयों का अन्वेषण करके यह ज्ञात किया कि “लम्बे पिताओं के पुत्र भी लम्बे होते है, तथा छोटे पिताओं के पुत्र भी छोटे होते हैं, परन्तु लम्बे पिताओं के पुत्री की औसत ऊँचाई उनके पिताओं की ऊँचाई की औसत से कम होती है तथा छोटे पिताओं के पुत्रों की औसत ऊँचाई उनके पिताओं की ऊँचाई की औसत से अधिक होती है।”

     गाल्टन ने मानव जाति में सामान्य ऊँचाई (normal height) की ओर लौटने की प्रवृत्ति को प्रतीपगमन को संज्ञा दी है।


उत्तर लिखने का दूसरा तरीका


Regression Analysis

Introduction:

     The mutual relationship between two Series is measured with the help of Correlation. Under correlation the direction and magnitude of the relationship between two variables is measured. But it is not possible to make the best estimate of the value of a dependent Variable on the basis of the given value of the Independent Variable by correlation analysis.

     Therefor, to make the best estimates and future estimation, the Study of regression analysis is very Important useful.

Meaning:

     Regression is the Study of the nature of relationship between that one may be able to Predict the Unknown value of one variable for a known value of another Variable.

     In regression, one variable is considered as an independent Variable and another Variable is taken as dependent Variable. with the help of regression, possible values of the dependent Variable are estimated on the basis of values of the independent variable.

     for example demand and price.

On the basis of this relationship between demand and price probable Value of demand can be estimated Corresponding to the different Values of place.

⇒ Regression Analysis is the technique for measuring or estimating the relationship among Variables.

⇒ Regression Analysis provides estimates of Values of the dependent Variable From the Values of the independent Variable.

⇒ The device used to accomplish this estimation procedure is the regression line.

⇒ The regression line describes the average relationship existing between x and y.

Exmple-

x y
4 100
7 92
15 90
18 82
20 79
25 74
28 68
. .
. .
35 ?    (here, x given, y=?)
. .
. .
?  (here, y given, x=?) 20

Difference Between Correlation and Regression

Correlation Analysis Regression Analysis
1. Correlation coefficient  is a measure of degree of covariability between x and y. 1. Objective of regression analysis is to Study the nature of relationship between Variables.
2. In Correlation analysis we can not say that one Variable is the cause & other the effect. 2. in regression analysis it is possible to study Cause & effect relationship.
3. In Correlation analysis both rxy & ryx are Symmetric (rxy=ryx) 3. In regression analysis bxy & byx are not Symmetric. (bxy≠byx)
4. There may be measure Correlation which has no practical relevance such as Increase in income & increase in weight. 4. There is nothing like non-Sense regression.
5. Correlation coeff. is independent of change of scale and origin.  5. Regression coefficientsare independent of change of origin but not of scale.

Similarity: Correlation coeff. (r) and regression coeff. (bxy & byx always have Same Sign.

UTILITY OF REGRESSION

(i) Nature of Relationship:-

    Regression analysis explains the nature of relationship between two variables.

(ii) Estimation of Relationship:-

     The mutual relationship between two or more variables can be measured easily by regression analysis.

(iii) Prediction:-

      By regression analysis, the value of a dependent variable can be predicted on the basis of the value of an independent variable. For example, if the price of a commodity rises, what will be the probable fall in demand, this can be predicted by regression.

(iv) Useful in Economic and Business research:-

    Regression analysis is very useful in business and economic research. With the help of regression, business and economic policies can be formulated.

TYPES OF REGRESSION ANALYSIS

1. Simple and Multiple Regression:-

      In simple regression analysis, we study only two variables at the time, in which one variable is dependent and another is independent. For example income and expenditure.

      on the contrary, we study more than two variables at a time in multiple, regression analysis in which one is dependent variable and others are independent variable. For example the study of rain and irrigation, the study of effect of rain and irrigation on yield of wheat.

2. Linear and Non-Linear Regression:-

    when one variable changes with other variable in some fixed ratio, this is called linear regression. such type of relationship is depicted on a graph by means of straight line.

    On the other hand when one variable varies with other variable in a changing ratio, then it is referred to as curvi-linear or Non-linear regression. This relationship, expressed on a graph paper takes the form of curve.

3. Partial and Total Regression:-

     When two or more variables are studied for functional relationship but at a time relationship between only two variables is studied and other variables held constant then it is known as partial regression. On the other hand, in total regression all variables are studied simultaneous for the relationship among them.

Simple Linear Regression

Regression lines:

     Regression lines are linear equations that show the relationship between two variables. These help in making predictions, understanding trends and determining the direction of changes in the data.

Regression lines
Regression line of y on x Regression line of x on y
1. y-ȳ = byx (x-x̄)

byx is regression coeff. of y on x

byx =

1. x-x̄ = bxy (y-ȳ)

bxy is regression coeff. of x on y

bxy =
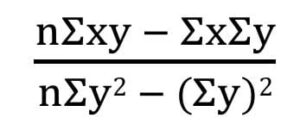
Both lines intersect at point (x̄, ȳ),  x̄ = Mean of x, ȳ = Mean of y
2. x→ Independent variable

y→ Dependent variable

2. x→Dependent variable

y→ Independent variable

3. Used to calculate y for given x 3. Used to calculate y for given y
4. Regression equation of y on x, y = a+bx 4. Regression equation of x on y, x = a+by

Methods of Obtaining Regression Lines

(i) Scatter Diagram Method:-

      This is the simplest method of constructing regression lines, In this method, values of the related variables are plotted on a graph. A straight line is drawn passing through the plotted points. The straight line is drawn with free hand. This shape of regression line can be linear or non-linear also. This depends upon the location of plotted points. This method is very rarely used in practicle because in this method, the decision of the person who draws the regression lines very much affects the result.

(ii) Least Square Method:-

    Regression lines are also constructed by least Square method. Under this method, the two regression lines, is fitted through different points in such a way that the sum of squares of the deviations of the observed values from the fitted line shall be least. The line drawn by this method is called the Line of Best Fit. In other words, regression line of Y on X is so drawn such that vertically, the sum of squared deviation becomes minimum relating to the different points and the regression line on X on Y is so drawn such that horizontally, squared deviations of different points add up to minimum.

Regression Lines

and

Degree of Correlation

REGRESSION EQUATIONS

   Regression equations are the algebraic formulation of regression lines. Regression equations present Regression lines.

(i) Regression equation of x on y

     This equation is used to estimate the probable value of x on the basis of the given value of y.

⇒ x-x̄ = bxy (y-ȳ)

(ii) Regression Equation of y on x

     This equation is used to estimate the probable value of y on the basis of given value of x.

⇒ y-ȳ = byx (x-x̄)

REGRESSION COEFFICIENTS

    Regression Coefficient measures the average change in the value of one variable for a unit change in the value of another variable. r Infact, it represents the slope of a regression line.

(i) Regression Coefficient x on y

     This Coefficient shows that with the unit change in the value of y variable, what will be the average change in the value of x variable.

bxy = r . σx/σy

(ii) Regression coefficient of y on x

    This Coefficient shows that with a unit change in the value of x variable, what will be the average change in the value of y variable.

byx = r . σy/σx

Example (i) Find both regression lines (x on y and y on x) for the following data.

x y
6 9
2 11
10 5
4 8
8 7

Calculation:

x y x2 y2 xy
6 9 36 81 54
2 11 4 121 22
10 5 100 25 50
4 8 16 64 32
8 7 64 49 56
30 40 220 340 214

n = 5

x̄ = Σx/n = 30/5 = 6

ȳ = Σy/n = 40/5 = 8

byx =

= 5×214 – 30×40 / 5×220 – 30×30

= -0.65

bxy =

= 5×214 – 30×40 / 5×340 – 40×40

= -1.3

now,

x on y ⇒ x-x̄ = bxy (y-ȳ)

⇒ x-6 = -1.3(y-8)

⇒ x-6 = -1.3y + 1.3×8

⇒ x = -1.3y + 10.4 + 6

⇒ x = -1.3y + 16.4

y on x ⇒ y-ȳ = byx (x-x̄)

⇒ y-8 = -0.65 (x-6)

⇒ y-8 = -0.65x + 0.65×6

⇒ y = -0.65x + 3.9+8

⇒ y = -0.65x + 11.9

Example (ii) From the following data:

(a) Obtain two regression lines

(b) Calculate correlation coeff.

(c) Estimate the value of y for x = 6.2

x y
1 9
2 8
3 10
4 12
5 11
6 13
7 14
8 16
9 15

Calculation:

(a) Obtain two regression lines

Note: x on y ⇒ x-x̄ = bxy (y-ȳ)

y on x ⇒ y-ȳ = byx (x-x̄)

(i) For direct method 

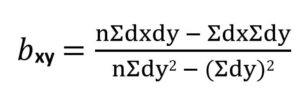
We’ll need ⇒ x̄, ȳ, bxy, byx

r =

bxy =

byx =

Finally we’ll need ⇒ n, Σx, Σy, Σx2, Σy2, Σxy 

(ii) For Short-cut method :-

       समानान्तर माध्य की संख्या पूर्णांक में हो तो प्रत्यक्ष रीति द्वारा प्रतीपगमन गुणांक सरलता से प्राप्त किये जा सकते हैं, लेकिन यदि ये माध्य पूर्णांक में नहीं आये तब लघु रीति अपनाना अधिक उपयुक्त होगा। इस रीति में अग्र सूत्रों की सहायता से प्रतीपगमन गुणांकों की गणना की जाती है:

Note: x→ dx = x-A,

y→ dy = y-B

x y dx 

(x-5)

dy

(y-12)

dx2  dy2 dx dy
1 9 -4 -3 16 9 12
2 8 -3 -4 9 16 12
3 10 -2 -2 4 4 4
4 12 -1 0 1 0 0
5 (A) 11 (B) 0 -1 0 1 0
6 13 1 1 1 1 1
7 14 2 2 4 4 4
8 16 3 4 9 16 12
9 15 4 3 16 9 12
45 108 0 0 60 60 57

Regression Co-efficient of X on Y

bxy = 9(57) – 0(0) / 9(60) – (0)2 

        = 0.95

Regression Co-efficient of Y on X
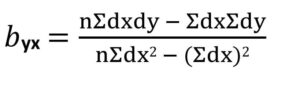
byx = 9(57) – 0(0) / 9(60) – (0)2

        = 0.95

x̄ = Σx/n = 45/9 = 5

ȳ = Σy/n = 108/9 = 12

now,

x on y ⇒ x-x̄ = bxy (y-ȳ)

⇒ x – 5 = 0.95(y-12)

⇒ x – 5 = (0.95)y – 0.95(12)

⇒ x = (0.95)y – 11.4 + 5

⇒ x = (0.95)y – 6.4

y on x ⇒ y-ȳ = byx (x-x̄)

⇒ y – 12 = 0.95(x – 5)

⇒ y – 12 = (0.95)x – 0.95 (5)

⇒ y – 12 = (0.95)x – 4.75

⇒ y = (0.95)x – 4.75 + 12

⇒ y = (0.95)x + 7.25

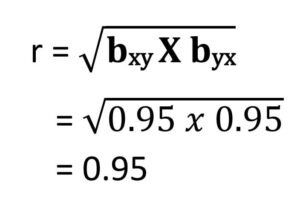
(b) Calculate correlation coeff.
(c) Estimate the value of y for x = 6.2

y on x ⇒ y-ȳ = byx (x-x̄)

⇒ y = (0.95)x + 7.25

⇒ y = (0.95)6.2 + 7.25

⇒ y = 5.89 + 7.25

⇒ y = 13.14

Chapter 8 Composition and Structure of Atmosphere (वायुमंडल का संघटन तथा संरचना)

Chapter 8 Composition and Structure of Atmosphere

(वायुमंडल का संघटन तथा संरचना)

(भाग – 1 : भौतिक भूगोल के मूल सिद्धांत)

बिहार बोर्ड तथा NCERT कक्षा 11वीं के भूगोल का सम्पूर्ण प्रश्नोत्तर


Chapter 8 Composition and Structure

1. बहुवैकल्पिक प्रश्न एवं उनके उत्तर

(i) निम्नलिखित में से कौन-सी गैस वायुमण्डल में सबसे अधिक मात्रा में मौजूद है?

(क) ऑक्सीजन

(ख) आर्गन

(ग) नाइट्रोजन

(घ) कार्बन डाइऑक्साइड

उत्तर- (ग) नाइट्रोजन

(ii) वह वायुमण्डलीय परत जो मानव जीवन के लिए महत्त्वपूर्ण है-

(क) समताप मण्डल

(ख) क्षोभमण्डल

(ग) मध्य मण्डल

(घ) आयनमण्डल

उत्तर- (ख) क्षोभमण्डल

कारण: क्षोभमण्डल (Troposphere) पृथ्वी की सबसे निचली वायुमंडलीय परत है, जहाँ मानव जीवन, मौसम, वर्षा, हवा, बादल और जलवाष्प सभी मौजूद होते हैं। इसी परत में हम सांस लेने योग्य अधिकांश ऑक्सीजन और नाइट्रोजन भी पाते हैं। इसलिए यह मानव जीवन के लिए सबसे महत्त्वपूर्ण परत है।

(iii) समुद्री नमक, पराग, राख, धुएँ की कालिमा, महीन मिट्टी-किससे सम्बन्धित हैं?

(क) गैस

(ख) जलवाष्प

(ग) धूलकण

(घ) उल्कापात

उत्तर- (ग) धूलकण

व्याख्या: समुद्री नमक, पराग, राख, धुएँ की कालिमा और महीन मिट्टी सभी वायुमंडलीय धूलकण (Aerosols) के उदाहरण हैं। ये वायुमंडल में तैरने वाले ठोस तथा तरल कण होते हैं जो बादल गठन, वर्षण एवं दृश्यता को प्रभावित करते हैं।

(iv) निलिखित में से कितनी ऊँचाई पर ऑक्सीजन की मात्रा नगण्य हो जाती है?

(क) 90 किमी

(ख) 100 किमी

(ग) 120 किमी

(घ) 150 किमी

उत्तर- (ग) 120 किमी

व्याख्या: पृथ्वी के वायुमंडल में ऊँचाई बढ़ने के साथ गैसों की घनत्व बहुत तेजी से कम होती है। लगभग 120 किमी की ऊँचाई तक पहुँचते-पहुँचते वायुमंडल इतना विरल हो जाता है कि ऑक्सीजन की मात्रा लगभग नगण्य मानी जाती है।

(v) निम्नलिखित में से कौन-सी गैस सौर विकिरण के लिए पारदर्शी है तथा पार्थिव विकिरण के लिए अपारदर्शी?

(क) ऑक्सीजन

(ख) नाइट्रोजन

(ग) हिलीयम

(घ) कार्बन डाइऑक्साइड

उत्तर- (घ) कार्बन डाइऑक्साइड

(vi) वायुमण्डल की कौन-सी परत पृथ्वी से प्रेषित रेडियो तरंगों को परावर्तित कर पुनः वापस कर पृथ्वी तल पर भेज देती है?

(क) समताप मण्डल

(ख) मध्य मण्डल

(ग) आयन मण्डल

(घ) बर्हिमण्डल

उत्तर- (ग) आयन मण्डल

2. निम्नलिखित प्रश्नों के उत्तर लगभग 30 शब्दों में दीजिए

(i) वायुमण्डल से आप क्या समझते हैं?

उत्तर- वायुमण्डल विभिन्न प्रकार की गैसों का मिश्रण है और यह पृथ्वी को सभी ओर से ढके हुए है। इसमें मनुष्यों एवं जन्तुओं के जीवन के लिए आवश्यक गैसों जैसे ऑक्सीजन तथा पौधों के लिए कार्बन डाईऑक्साइड पाई जाती हैं।

(ii) मौसम और जववायु के कौन-कौन से तत्त्व हैं?

उत्तर- तापमान, वायुदाब, हवा, आर्द्रता, बादल और वर्षण ये मौसम और जलवायु के महत्त्वपूर्ण तत्त्व हैं, जो पृथ्वी पर मुनष्य के जीवन को प्रभावित करते हैं।

(iii) वायुमण्डल की संरचना के बारे में लिखिए।

उत्तर- वायुमण्डल का निर्माण लगभग एक अरब वर्ष पूर्व हुआ। यह अनेक गैसों का मिश्रण है। नाइट्रोजन 78.8% तथा ऑक्सीजन 20.95% मुख्य गैसें हैं। इनके अतिरिक्त आर्गन, कार्बन डाइऑक्साइड, नीऑन, हीलियम, क्रेप्टोन, जेनन तथा हाइड्रोजन भी कुछ मात्रा में है।

     वायुमण्डल में पाँच मुख्य संस्तर हैं- क्षोभमण्डल, समतापमण्डल, मध्यमण्डल, आयनमण्डल, बाह्ममण्डल। कुल वायुमण्डल का 99% भाग भूपृष्ठ से 32 कि.मी. की ऊँचाई तक सीमित हैं और गुरुत्वाकर्षक बल द्वारा पृथ्वी से सटा हुआ है। वायुमण्डल को ऊर्जा सूर्य से मिलती है।

(iv) वायुमण्डल के सभी संस्तरों से क्षोभमण्डल सबसे अधिक महत्त्वपूर्ण क्यों हैं?

उत्तर- क्षोभमण्डल सबसे अधिक महत्त्वपूर्ण है क्योंकि इसी में पृथ्वी का अधिकांश मौसमीय क्रियाएँ- बादल, वर्षा, आँधी, तूफान हुआ करती हैं। वायु दाब, तापमान तथा जलवाष्प की अधिकता इसे जीवन के लिए अनिवार्य बनाती है।

   अधिकांश जैविक एवं मानव गतिविधियाँ इसी संस्तर में संचरित होती हैं। क्षोभमण्डल वायुमण्डल का सबसे नीचे का संस्तर है। इसकी ऊंचाई 13 किमी है तथा यह ध्रुव के निकट 8 किमी तथा विषुवत् रेखा पर 18 किमी की ऊँचाई तक है। 

(v) ग्रीन हाऊस प्रभाव से आप क्या समझते हैं?

उत्तर- वायु प्रदूषण से सम्बन्धित एक बड़ी समस्या विश्व के तापमान में वृद्धि (Global Warming) या हरित गृह प्रभाव (Green House effect) है। मानवीय स्त्रोतों से उत्पन्न कुछ गैस कार्बन डायऑक्साइड, ओजोन, नाइट्रस ऑक्साइड और मीथेन है, जो हरित गृह प्रभाव में वृद्धि करतें हैं।

    इनमें सबसे महत्त्वपूर्ण कार्बन डाइऑक्साइड है, जो सौर ऊर्जा को पृथ्वी की ओर आने तो देता है, किन्तु पृथ्वी से जो धरातलीय विकरण होता है, उसे बाहर जाने से रोकती है और उसका अवशोषण करता है। अतः वायुमण्डल में कार्बन डाइऑक्साइड के वृद्धि होने से पृथ्वी की सतह और वायुमण्डल के निचले भाग में तापमान की वृद्धि होती है जिसे हरित गृह प्रभाव कहा जाता है।

(vi) वायुमण्डल के मुख्य संघटनों का संक्षिप्त विवरण दें।

उत्तर- वायुमण्डल के मुख्य संघटन:

     वायुमण्डल मुख्यतः नाइट्रोजन (78%), ऑक्सीजन (21%), आर्गन (0.93%) और कार्बन डाइऑक्साइड (0.04%) से बना है। इसके अलावा नीयॉन, हीलियम, हाइड्रोजन, जलवाष्प, धूलकण तथा ओजोन अल्प मात्रा में पाए जाते हैं, जो जलवायु व मौसम को प्रभावित करते हैं।

3. निम्नलिखित प्रश्नों के उत्तर लगभग 150 शब्दों में दीजिए

(i) वायुमण्डल की संरचना की व्याख्या करें।

उत्तर- वायुमण्डल की संरचना:

      पृथ्वी को चारों ओर से घेरे हुए गैसों के विशाल आवरण को वायुमण्डल कहते हैं। इसका मुख्यतः गठन नाइट्रोजन (78%), ऑक्सीजन (21%) तथा अन्य गैसों जैसे कार्बन डाइऑक्साइड, हीलियम, हाइड्रोजन, आर्गन आदि से होता है। वायुमण्डल को ऊँचाई के आधार पर पाँच मुख्य परतों में बाँटा गया है- क्षोभ मण्डल, समताप मण्डल, मध्य मण्डल, आयन मण्डल और बाह्य मण्डल।

1. क्षोभ मण्डल (Troposphere):

    यह पृथ्वी की सतह से लगभग 8-18 किमी तक विस्तृत सबसे निचली परत है। सभी मौसमीय घटनाएँ- बादल, वर्षा, तूफान आदि इसी परत में होते हैं। ऊँचाई के साथ तापमान कम होता जाता है।

2. समताप मण्डल (Stratosphere):

    क्षोभमण्डल के ऊपर 50 किमी तक फैली यह परत उड़ान विमानों के लिए उपयुक्त है। इसमें ओजोन परत स्थित है, जो हानिकारक पराबैंगनी किरणों को अवशोषित करती है।

3. मध्य मण्डल (Mesosphere):

    यह 50-80 किमी तक फैला होता है। यहाँ तापमान पुनः घटता है और उल्का पिंड अक्सर इसी में जलकर नष्ट हो जाते हैं।

4. आयन मण्डल (Thermosphere):

    80-500 किमी तक विस्तृत, यहाँ गैसें आयनित रहती हैं। रेडियो तरंगों का परावर्तन भी यहीं होता है।

5. बाह्य मण्डल (Exosphere):

   यह सबसे बाहरी परत है जहाँ गैसों का घनत्व अत्यंत कम होता है और यहीं से अंतरिक्ष की शुरुआत मानी जाती है।

    इस प्रकार वायुमण्डल पृथ्वी पर जीवन की रक्षा करता है और जलवायु व ताप संतुलन बनाए रखता है।

(ii) वायुमण्डल की संरचना का चित्र खींचे और व्याख्या करें।

उत्तर- वायुमण्डल की संरचना का चित्र

वायुमण्डल की संरचना


    वायुमण्डल को ऊँचाई के आधार पर पाँच मुख्य परतों में बाँटा गया है- क्षोभ मण्डल, समताप मण्डल, मध्य मण्डल, आयन मण्डल और बाह्य मण्डल।

1. क्षो भमण्डल (Troposphere):

    यह पृथ्वी की सतह से लगभग 8–18 किमी तक विस्तृत सबसे निचली परत है। सभी मौसमीय घटनाएँ- बादल, वर्षा, तूफान आदि इसी परत में होते हैं। ऊँचाई के साथ तापमान कम होता जाता है।

2. समताप मण्डल (Stratosphere):

    क्षोभमण्डल के ऊपर 50 किमी तक फैली यह परत उड़ान विमानों के लिए उपयुक्त है। इसमें ओज़ोन परत स्थित है, जो हानिकारक पराबैंगनी किरणों को अवशोषित करती है।

3. मध्य मण्डल (Mesosphere):

    यह 50–80 किमी तक फैला होता है। यहाँ तापमान पुनः घटता है और उल्का पिंड अक्सर इसी में जलकर नष्ट हो जाते हैं।

4. आयन मण्डल (Thermosphere):

    80-500 किमी तक विस्तृत, यहाँ गैसें आयनित रहती हैं। रेडियो तरंगों का परावर्तन भी यहीं होता है।

5. बाह्य मण्डल (Exosphere):

    यह सबसे बाहरी परत है जहाँ गैसों का घनत्व अत्यंत कम होता है और यहीं से अंतरिक्ष की शुरुआत मानी जाती है।

    इस प्रकार वायुमण्डल पृथ्वी पर जीवन की रक्षा करता है और जलवायु व ताप संतुलन बनाए रखता है।

error: